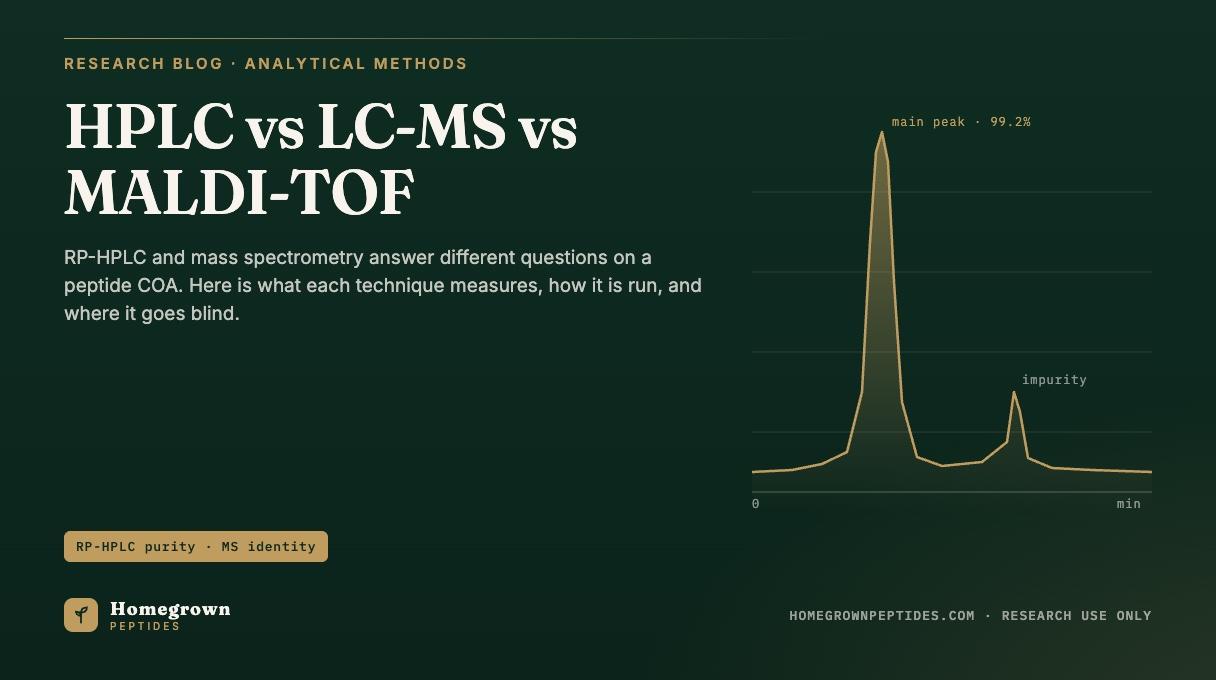
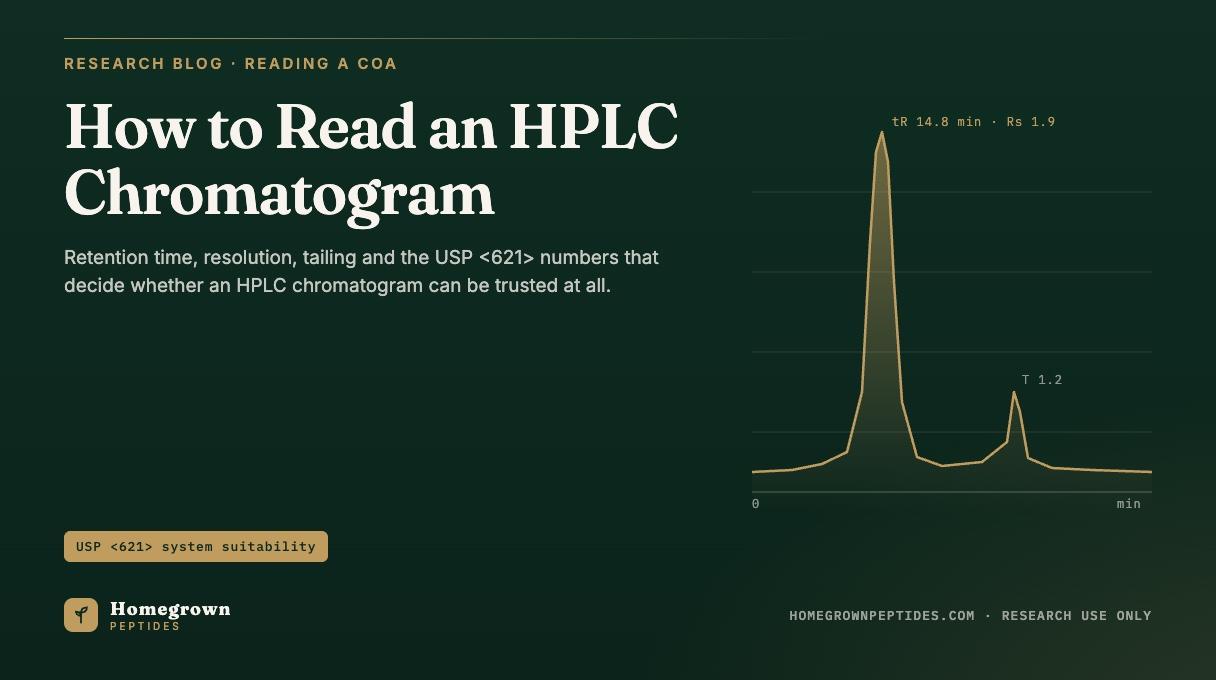
A chromatogram plots detector response against time. The main peak's retention time identifies the compound under a fixed method, its area fraction gives a purity number, and the trace's shape tells you whether that number can be trusted. Resolution (Rs), tailing factor (T), signal to noise and injection repeatability are the USP <621> system suitability parameters that decide whether a run was valid, before the purity figure means anything.
| Parameter | Definition | Typical acceptance | Source |
|---|---|---|---|
| Retention time (tR) | Minutes from injection to peak maximum | Matches reference standard within the method's stated window | USP General Chapter <621> |
| Resolution (Rs) | Separation between two adjacent peaks, scaled to their widths | Rs ≥ 1.5 for baseline separation | USP <621> |
| Tailing factor (T) | Asymmetry of the peak at 5% of its height | T ≤ 2.0 (often tighter for assay methods) | USP <621> |
| Theoretical plates (N) | Column efficiency, calculated from peak width and retention time | Method dependent; stated in the validated procedure | USP <621> |
| Injection repeatability (%RSD) | Relative standard deviation of replicate peak areas or retention times | ≤ 2.0% for n = 5 or 6 replicate injections (assay methods) | USP <621> |
| Capacity factor (k) | How strongly a compound is retained relative to an unretained marker | Typically k ≥ 2 for reliable quantitation | Mant et al., 2007 (PubMed PMID 18604941) |
What Do the Axes and the Baseline Tell You?
The x axis is time, usually minutes; the y axis is detector response, usually milli absorbance units (mAU) from a UV detector at a fixed wavelength. A gradient method ramps the mobile phase over the run, so the baseline commonly drifts upward as organic content increases, since trace UV absorbing impurities already in the solvents absorb more as their share rises; a blank injection on the same gradient separates that drift from a real artifact. The void time, t0, is the time an unretained compound takes to reach the detector, showing up as a disturbance at the very start of the trace, often called the injection peak or solvent front, marking the earliest point any real retention can be measured.
What Is Retention Time, and Why Does It Move?
Retention time (tR) is the time from injection to the peak's maximum. Under a fixed method it functions as a presumptive identity marker: a peptide eluting at 14.8 minutes today should elute at 14.8 minutes, within a stated window, tomorrow, on the same column and gradient. The retention factor, k = (tR − t0) / t0, is more useful for comparing across methods because it normalizes out the void time.
Retention time moves for reasons unrelated to the sample: column temperature, gradient slope, mobile phase pH (which changes the ionization state of acidic and basic side chains), ion pairing reagents such as trifluoroacetic acid (TFA), which mask charged groups and change how strongly a peptide is retained (Guo DC, Mant CT, Hodges RS. 1987), and column aging. Because any of these can move tR independent of identity, a retention time match is identity evidence only under the exact method that produced it, not a universal fingerprint. A certificate stating column, mobile phase, gradient and temperature gives a reader the conditions needed to reproduce that retention time; a bare number alone cannot be checked against anything. A worked example sits on the Semax Nasal Spray page, where the lot retention time is published next to the method that produced it.
How Is Resolution Calculated, and What Value Is Enough?
Resolution (Rs) measures how well two adjacent peaks are separated, scaled to how wide they are: Rs = 2(tR2 − tR1) / (w1 + w2), where tR1 and tR2 are the two peaks' retention times and w1 and w2 are their baseline widths. An Rs of 1.5 or greater is generally treated as baseline resolution: the peaks return to baseline between them and integrate independently with minimal error. Below that, the peaks overlap and the area assigned to each becomes a function of where the integration software draws the line, rather than a property of the sample. If a closely related impurity, a deletion sequence or an oxidized variant for example, sits at Rs below 1.5 from the main peak, some of its area gets folded into the main peak's integration and the reported purity is inflated, a point covered further in HPLC Purity Explained, which focuses on what the area percent itself measures.
What Do Tailing, Fronting and Shoulders Mean?
A well behaved peak is close to Gaussian: symmetric around its maximum, and real peaks deviate in diagnostic ways. Tailing factor (T) quantifies asymmetry at 5% of peak height: T = W0.05 / (2f), where W0.05 is the full peak width at that height and f is the distance from the leading edge to the peak maximum at the same height. A symmetric peak has T close to 1.0; USP <621> commonly sets T ≤ 2.0 as the limit. Tailing in reversed phase peptide separations is frequently traced to interactions between basic residues and residual silanol groups on the silica surface, to column overload, or to voids in the packed bed as a column ages, a behavior documented for basic compounds across conventional reversed-phase packings (Stella C, et al. 2004). Fronting, the mirror image, usually points to overload as well, or to a mismatch between sample solvent strength and the mobile phase at injection.
A shoulder, a bump beside the main peak rather than a fully resolved second peak, is one of the more consequential things to miss. It can represent a closely eluting impurity, a related substance from synthesis, or a diastereomer from an inverted residue. Because it often falls inside the main peak's integration window by default, it can be quietly counted as the compound of interest unless integration is set to detect it specifically. Mass spectrometry alongside the same separation, discussed in Reading the Mass Spectrum on a Peptide COA, is one of the few ways to confirm whether it is a real second species; impurity-profiling studies pairing LC with mass spectrometry on synthetic peptides describe this kind of shoulder as a related substance or deletion sequence, not noise (De Spiegeleer B, Vergote V, et al. 2008; D'Hondt M, et al. 2014).
What Do Signal to Noise, LOD and LOQ Mean on a Purity Trace?
Noise is the baseline's random fluctuation when nothing is eluting; signal to noise (S/N) compares a peak's height to that noise. By convention, roughly three times the noise level is the limit of detection (LOD), the smallest signal reliably distinguished from noise at all, while roughly ten times the noise level is the limit of quantitation (LOQ), the smallest signal measured with acceptable precision rather than merely detected.
This has a direct consequence for impurity reporting: a method that cannot put enough sample mass on the column to push a 0.05% impurity above its LOQ will not report it, not because it is absent but because the method cannot see it at that load. Detection wavelength matters too. Most peptide RP-HPLC methods read at 214 nm or 220 nm, near the amide backbone's absorbance, rather than at 280 nm, which depends on aromatic residues many short peptides carry in only one copy or lack entirely, part of why a second, independent technique, covered in HPLC vs LC-MS vs MALDI-TOF, is worth cross checking.
What Is System Suitability Under USP <621>?
System suitability testing is the set of checks run before, and often during, a method to confirm the instrument, column and operator are together producing trustworthy data that day. It is not a statement about the sample; it is a statement about whether the measurement is valid.
| Parameter | Formula | Typical acceptance |
|---|---|---|
| Resolution (Rs) | Rs = 2(tR2 − tR1) / (w1 + w2) | Rs ≥ 1.5 (baseline resolution) |
| Tailing factor (T) | T = W0.05 / (2f) | T ≤ 2.0 |
| Theoretical plates (N) | N = 16(tR/W)² or N = 5.54(tR/W0.5)² | Method dependent; often N ≥ 2000 to 5000 for a well packed column |
| Injection repeatability (%RSD) | %RSD = (standard deviation / mean) x 100, over n replicate injections | ≤ 2.0% for n = 5 or 6 (assay methods) |
| Capacity factor (k) | k = (tR − t0) / t0 | Typically k ≥ 2 |
Theoretical plates (N) measure column efficiency: how narrow a peak the column produces at a given retention time. A column that has lost efficiency, through fouling, void formation or bonded phase loss, produces broader peaks at the same tR, lowering both N and resolution. Injection repeatability, reported as %RSD across replicate injections, tests the instrument and operator rather than the column chemistry: a high %RSD means the purity number is noisy before any question about the sample is even asked.
How Do Integration Choices Change the Purity Number?
Integration turns raw detector signal into a peak area, through choices easy to overlook on a finished chromatogram. A baseline drop draws a straight line under a peak from start to end. A valley to valley setting draws that line between the minima separating adjacent peaks, common when peaks are not fully resolved. A tangent skim cuts off a small shoulder with a line tangent to the larger peak's baseline, assigning the overlap to the main peak rather than splitting it.
Threshold and minimum area settings decide how small a bump has to be before the software calls it a peak. Set too high, small impurities fold into the baseline; set too low, noise gets called peaks. Two labs integrating the same raw data file can report the same main peak at 98.6% in one case and 99.3% in the other, with neither having touched the sample, which is why net peptide content and purity are different numbers, addressed in What Does 99% Purity Mean on a Peptide COA?. A certificate disclosing only a final percentage gives a reader nothing to check it against; one that states column, gradient, wavelength and integration parameters, such as what Homegrown Peptides publishes alongside its semax research lots, does.
A Worked Read of a Hypothetical Peptide Trace
Consider a trace with t0 at 1.2 minutes, a main peak at 14.8 minutes, a small shoulder at 15.1 minutes, and a separate late peak at 18.3 minutes. The main peak's capacity factor is k = (14.8 − 1.2) / 1.2, or roughly 11.3, comfortably above the k ≥ 2 guideline, so the peptide is well retained and unlikely to be confused with anything at the solvent front.
The shoulder at 15.1 minutes sits only 0.3 minutes away. Given typical peak widths for a well packed peptide separation, its resolution from the main peak is likely well under 1.5, so it is not cleanly separated; its area could be split out as a small impurity or folded into the main peak through a tangent skim. Either way, it flags something close enough to need a second method, such as mass spectrometry, rather than a guess from retention time alone.
The peak at 18.3 minutes is fully separated, so its resolution is not in question, but what it represents, a related substance, a degradation product or an unrelated contaminant, cannot be determined from retention time alone.
Frequently Asked Questions
What does a peak at the very start of the trace mean?
A disturbance right around t0 is usually the injection peak or solvent front, caused by the refractive index or UV background change as the solvent plug reaches the detector. It is not a retained compound and is not part of a purity calculation.
Why does the baseline rise during a gradient run?
As the mobile phase shifts toward more organic solvent, trace UV absorbing components already in that solvent contribute more background signal. A blank gradient run without sample separates this expected drift from real contamination or carryover.
Is a single peak proof that a sample is pure?
No. A single peak only shows that nothing else eluted and was detected under that method, wavelength and load. A co-eluting impurity with similar retention, or one below the LOQ, would not appear as a second peak even though it is present.
What is a ghost peak?
A peak appearing in a blank or sample run that does not correspond to anything intentionally injected. Causes include carryover from a prior injection, contamination in the mobile phase, or an artifact such as an air bubble. One that reappears at a consistent retention time across unrelated samples usually points to the system rather than the sample.
Why does my retention time differ slightly from the certificate?
Small shifts between runs on nominally the same method are common; column temperature, mobile phase preparation, flow rate accuracy and column age all introduce minor variation. A shift within the stated window is not a problem; a large shift suggests the method was not reproduced closely enough.
What does "RP-HPLC, 214 nm" mean on a certificate?
It states the technique, reversed phase high performance liquid chromatography, and the UV detection wavelength. The wavelength matters because peptide absorbance at 214 nm, driven mainly by the amide backbone, differs sharply from absorbance at 280 nm, which depends on aromatic side chains many peptides carry in only small numbers or not at all.
References
- Mant CT, Chen Y, et al. HPLC analysis and purification of peptides. Methods Mol Biol. 2007;386:3-55. PubMed PMID 18604941.
- Rathore AS, Winkle H. Quality by design for biopharmaceuticals. Nat Biotechnol. 2009;27(1):26-34. PubMed PMID 19131992.
- Guo DC, Mant CT, Hodges RS. Effects of ion-pairing reagents on the prediction of peptide retention in reversed-phase high-performance liquid chromatography. J Chromatogr. 1987;386:205-222. PubMed PMID 3558604.
- Stella C, Rudaz S, Mottaz M, Veuthey JL. Analysis of basic compounds at high pH values by reversed-phase liquid chromatography. J Sep Sci. 2004;27(4):284-292. PubMed PMID 15334915.
- De Spiegeleer B, Vergote V, Pezeshki A, et al. Impurity profiling quality control testing of synthetic peptides using liquid chromatography-photodiode array-fluorescence and liquid chromatography-electrospray ionization-mass spectrometry: the obestatin case. Anal Biochem. 2008;376(2):229-234. PubMed PMID 18342612.
- D'Hondt M, Bracke N, Taevernier L, et al. Related impurities in peptide medicines. J Pharm Biomed Anal. 2014;101:2-30. PubMed PMID 25044089.
- USP General Chapter <621> Chromatography, United States Pharmacopeia.
- International Council for Harmonisation. ICH Q2(R2): Validation of Analytical Procedures. 2023. database.ich.org.
- International Council for Harmonisation. ICH Q6B: Specifications: Test Procedures and Acceptance Criteria for Biotechnological/Biological Products. database.ich.org.
- U.S. Food and Drug Administration, Center for Drug Evaluation and Research. Analytical Procedures and Methods Validation for Drugs and Biologics, Guidance for Industry. fda.gov.
Research use only. Homegrown Peptides products are for laboratory research and are not for human or animal use. Nothing in this article is medical advice.